Budget and Gross Domestic Product
Gold, money, credit, and numbers.
National Accounts; Capital Accounts, Current Accounts, Payable, and Receivable.

Budget of The Dollar Empire. The White House and Congressional Budget Office publish public data for yearly budgets. In order to understand the trajectory I have reverse engineered their numbers. I am not an engineer.
Current Summary
| Line in Billions | 2020 | 2030 | 2040 | 2050 | 2060 |
| Discretionary | 1656 | 2047 | 2713 | 3525 | 4370 |
| Mandatory | 3839 | 4968 | 6556 | 8513 | 10555 |
| Income | 12177 | 15373 | 20392 | 26496 | 32852 |
| Exports | 3676 | 4986 | 6597 | 8569 | 10625 |
| Imports | 2926 | 4017 | 5309 | 6895 | 8549 |
| Ex-Im | 750 | 969 | 1288 | 1674 | 2076 |
| Investment | 4062 | 5335 | 7064 | 9176 | 11377 |
| Savings | 1959 | 2707 | 3554 | 4611 | 5717 |
| I-S | 2103 | 2628 | 3510 | 4565 | 5660 |
| Added Debt & Other | 1412 | 1664 | 2162 | 2800 | 3471 |
| Interest | -370 | -610 | -793 | -1027 | -1273 |
| Gross Domestic Product | 21568 | 27041 | 35830 | 46548 | 57712 |
| Population | 337657171 | 354817481 | 372774077 | 391543183 | 407141706 |
| GDP Per Capita (Level) | 63875 | 76211 | 96117 | 118883 | 141749 |
| GDP Growth | 0.253 | 0.324 | 0.299 | 0.239 | |
| Per Capita GDP Growth | 0.193 | 0.261 | 0.236 | 0.192 |
The forecast period ends with near $80 Trillion in debt at an interest rate of 1.69% which gives a calculated yearly payment of $1.352 Trillion. Compared to the forecast value of $1.273 Trillion yearly interest payment there is only a 6% discrepency between two methods of forecasting. The Budget forecasted for the 2060s is near $15 Trillion while the nation is forecasted to have a $57 Trillion Gross Domestic product.
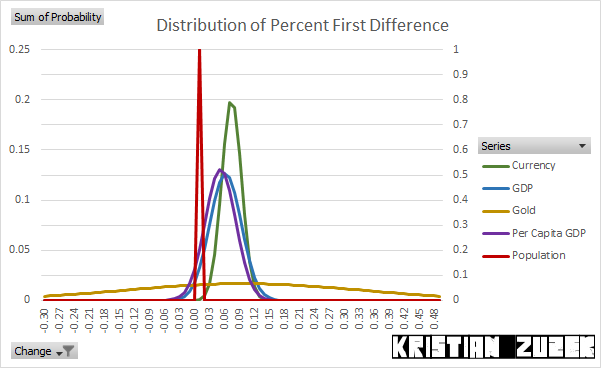
Historically, there are distinct differences between the variations of a group of significant series. Their distribution of yearly changes vary extremely differently each having a different mean. Population is the only series on the right vertical scale.
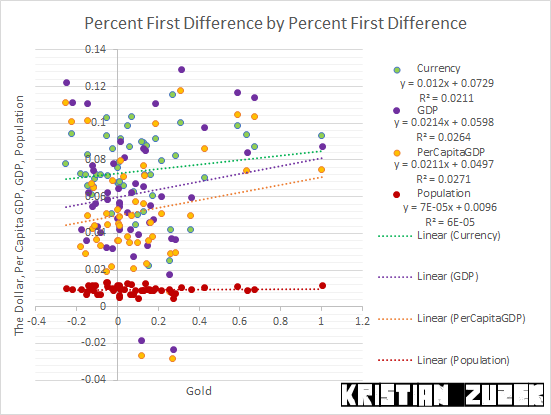
Volatility and Uncertainty in public policy implementation and geopolitical architecture often causes gold markets to change their price values higher. These higher price changes are associated with higher price changes in many other markets. The relationship between gold being priced higher with circulating currency, Gross Domestic Product, and Per Capita Gross Domestic Product moving in the same direction is a feedback loop. More population requires more circulating currency which increases the sum of Gross Domestic Product. Where the equilibrium lays in these relationships defines stability in dynamic systems. Everything is in a steady state until it is not. Everything works until it doesn't.
Conclusion
When a nation can manipulate the value of itself, its money and its people's time and energy then policies contra large disruptions to natural development can be executed with excess debt, stimulus spending, and lowered interest rates to reduce the cost of borrowing for finance maintainence, income support, and public projects.Technically, an economic forecast 40 years into the future has limited function.
Practically, an economic forecast 40 years into the future has limited value.