World Population
Calculations about quality and quantity.
How much resource is available per capita.
The identity to population growth is reduced space. Diminishing returns on investment.
Historic Changes.
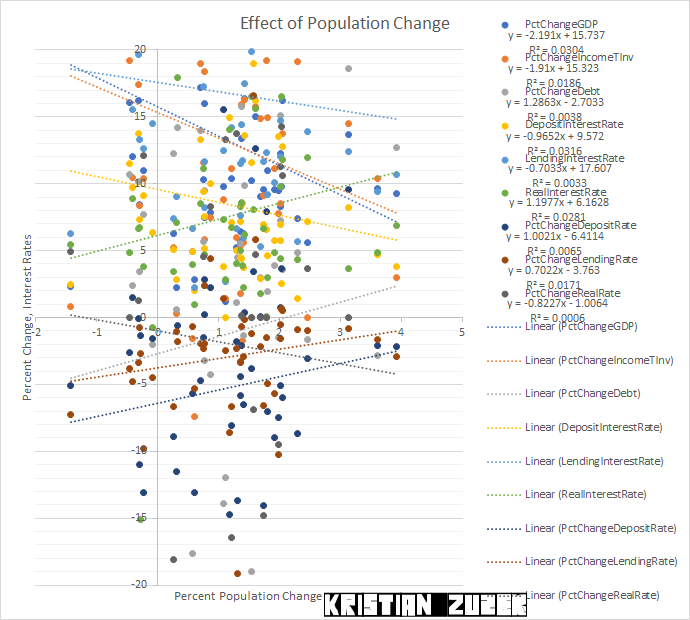
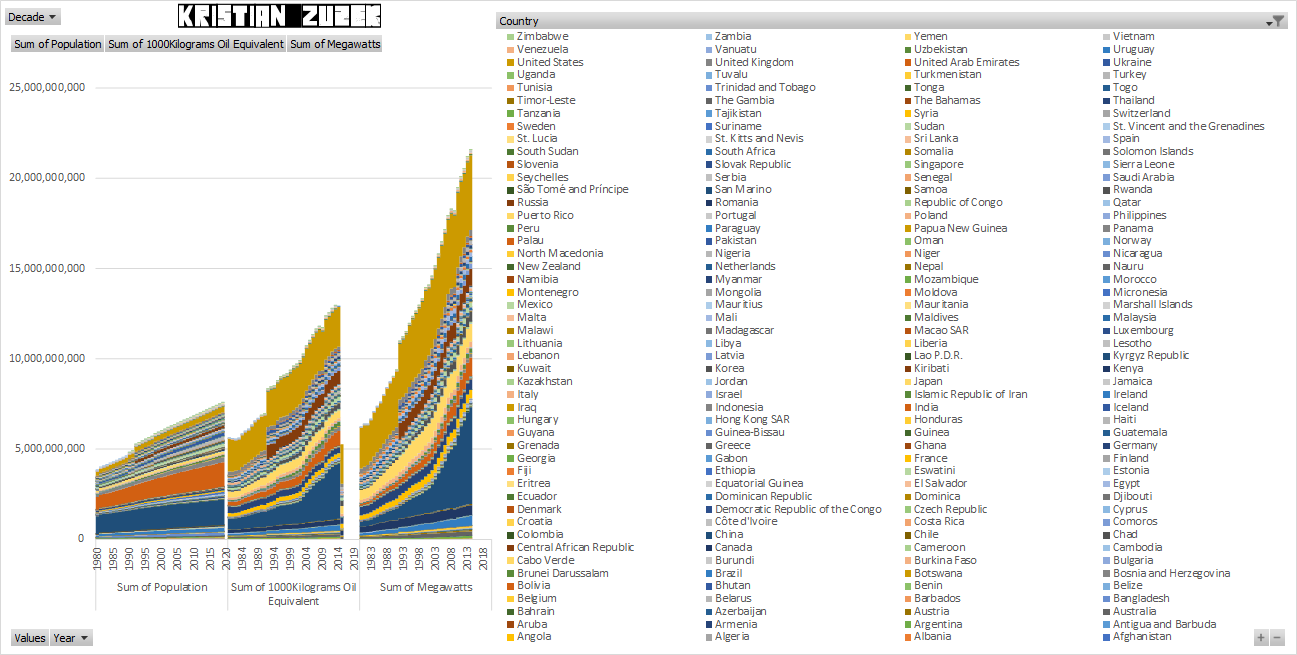
During the period analyzed, the following table describes the yearly general demographic relations. Included are two examples which show the lack of statistical significance but aggregate behavior of the table's expectations.
Australia: Percent Change Population 1.36, Percent Change GDP 5.63, Deposit Interest Rate 4.52, Real Interest Rate 5.04
Mexico: Percent Change Population 1.58, Percent Change GDP 23.32, Deposit Interest Rate 18.99, Real Interest Rate 8.09
Average of the two: Percent Change Population 1.47, Percent Change GDP 14.48, Deposit Interest Rate 11.75, Real Interest Rate 6.57
Expected from calculation: Percent Change Population 1.47, Percent Change GDP 12.52, Deposit Interest Rate 7.92, Real Interest Rate 5.11
| PctChangePopulation | PctChangeGDP | Real Rate | Deposit Rate | CalcDepositRate |
| -2 | 20.12 | 3.77 | 8.42 | 2.44 |
| -1 | 17.93 | 4.97 | 7.41 | 3.21 |
| 0 | 15.74 | 6.16 | 6.41 | 3.98 |
| 1 | 13.55 | 7.36 | 5.41 | 4.75 |
| 2 | 11.36 | 8.56 | 4.41 | 5.51 |
| 3 | 9.16 | 9.76 | 3.41 | 6.28 |
| 4 | 6.97 | 10.95 | 2.4 | 7.05 |
| 5 | 4.78 | 12.15 | 1.4 | 7.82 |
| Group OECD or Not OECD | 1980 | 1990 | 2000 | 2010 | 2020 |
| Not OECD | 2.33 | 1.85 | 1.77 | 1.6 | |
| OECD | 0.7 | 0.61 | 0.61 | 0.57 | |
Conclusion
Despite the promise of infinite growth I expect the more developed and educated nations and populations to continue slowing population growth.Due to increased development and education I expect the less developed and educated nations and populations to slow population growth.
With the level of technology relatively static for the foreseable future the benefit of decreasing population will not be financial. It would be personal.